Introduction
Sherlock.io is the platform of choice for all eBay monitoring needs, including applications, networks and devices. The centralized Sherlock.io platform manages different monitoring signals, such as logs, metrics, traces and events. The platform handles about 8 million metrics per second, 1 billion events per minute and multiple petabytes of logs every day. To run and manage a platform offering at such a high-volume scale, our monitoring team strives to build generic solutions with high availability and immense resilience.
Logs, Metrics and Events
Developers are familiar with the attributes and characteristics of log and metric signals. Logs typically represent a logline from an application or device logs and have a timestamp representing when the log record was made. Although logs are structured, performing log aggregation at scale can present challenges. Metrics are time-series data that have a name, a timestamp, dimensions (key-value pairs) and a numerical value associated with them.
We have defined a new monitoring signal, called events, in addition to logs and metrics. Events exhibit characteristics of both logs and metrics. They are immutable and present key signals in the system, such as database failure and device failure that could happen in surges. Examples of event use cases could be application traces or online analytical processing (OLAP) data. Events are monitoring signals that are strictly structured, and therefore, adhere to a schema format. They are not limited by the cardinality of data, or unique metric series, that most metrics backend systems are typically sensitive to. Throughout this blog, we will outline our journey in using Kubernetes to migrate OLAP event use-cases onto ClickHouse, a column-oriented database.
Problem Statement
Having defined an event signal, we looked at various backend solutions that would help us create a scalable and resilient platform for events while also supporting alerts. Our legacy OLAP use-case was built on Druid. Our OLAP data has application statistics for all eBay applications hosted on our infrastructure, processing around 1 billion OLAP events per minute on the pipeline. OLAP data gives quick insights into application health and other key statistics, such URL or transaction counts. We’ve run OLAP on Druid for years, but as our platform has scaled and as traffic has increased on OLAP, we sought new solutions to reduce the cost of maintaining Druid and occasional availability challenges.
We explored ClickHouse late last year and, based on documentation and extensive benchmarking tests, it seemed to fit our events use-case well and yielded impressive numbers. We found ClickHouse capable of handling high-ingestion volume without issues. We also did a cost comparison of infrastructure footprint and storage, which showed that we could cut back on our existing infrastructure used for Druid by over 90 percent.
However, the out-of-box read performance for ClickHouse did not work well for us. We performed techniques like data sharding and materialized views to improve read performance. A general problem, is that achieving high-read performance means understanding the user data, which can be difficult while hosting multiple customers and their data sets on the platform. ClickHouse also has other external dependencies, such as Zookeeper, for replication. ClickHouse also requires concrete tables and other dependencies, such as a buffer or distributed table, for the data pipeline to work smoothly.
Managing ClickHouse on Kubernetes
All applications within eBay are moving toward being hosted by an internally managed Kubernetes platform. Our desire was to have ClickHouse clusters spread across data centers. Our data centers are on the west coast of the U.S. and we expected little latency issues for data sync or replication. As part of that goal, we decided to create an operator that works on a federated control plane (refer to Kubernetes federation documentation on kubernetes.io) through which we can manage a single ClickHouse cluster across multiple regions. We created two, custom resource definitions on Kubernetes referred to as FederatedClickHouseInstallation (FCHI) and FederatedClickHouseCluster (FCHC).
FCHI represents different clusters that are deployed in our internal Kubernetes infrastructure. The following custom resource we have on FCHI represents all ClickHouse clusters in infrastructure. By following the example below, we have three clusters OLAP, events and a query cluster.

FCHI allows us to maintain all the cluster topologies at one place for discovery and join across multiple Clickhouse clusters. For each of the above CH clusters, we have an associated Federated ClickHouse cluster (FCHC) object. The CRD (Custom resource definition) for FCHC is quite extensive – consider the following instance of FCHC we have hosted in our infrastructure.
apiVersion: federatedclickhouse.sherlock.io/v1alpha1
kind: FederatedClickHouseCluster
metadata:
  annotations:
	io.sherlock.metrics.clickhouse-sidecar/hosts: ${data.host}:9116/metrics
	io.sherlock.metrics.clickhouse-sidecar/module: prometheus
	io.sherlock.metrics.clickhouse-sidecar/namespace: sherlock
	io.sherlock.metrics.clickhouse-sidecar/period: 1m
  name: olap
  namespace: sherlock-events
spec:
  configuration:
	clusters:
	- address:
    	clusterIndex: 0
  	layout:
    	replicasCount: 2
    	shardsCount: 10
  	name: olap
	files:
  	clickhouse-interserver-config.xml: |
	. . .
profiles:
  	default/allow_experimental_data_skipping_indices: "1"
  	default/parallel_view_processing: "1"
  	sherlockio/allow_experimental_data_skipping_indices: "1"
  	sherlockio/max_rows_to_read: "1000000"
  	sherlockio/parallel_view_processing: "1"
	settings:
  	max_concurrent_queries: 400
  	max_partition_size_to_drop: 100000000000
  	max_table_size_to_drop: 100000000000
	users:
  	default/networks/host_regexp: ""
  	default/networks/ip:
  	- ::/0
  	default/profile: default
  	default/quota: default
  	sherlockio/networks/host_regexp: ""
  	sherlockio/networks/ip:
  	- ::/0
  	sherlockio/profile: default
  	sherlockio/quota: default
	zookeeper:
  	nodes:
  	- host: zk-0
    	port: 2181
  	- host: zk-1
    	port: 2181
  	- host: zk-2.
    	port: 2181
  defaults:
	distributedDDL:
  	profile: default
	replicasUseFQDN: "no"
	templates:
  	dataVolumeClaimTemplate: default-volume-claim
  	podTemplate: clickhouse-v19.16.14
  	replicaServiceTemplate: replica-service-template
  stop: "no"
  templates:
	podTemplates:
	- distribution: ""
  	name: clickhouse-v19.16.14
  	podDistribution:
  	- number: 1
    	type: Unspecified
  	spec:
    	containers:
    	- env:
      	- name: pod_ip
        	valueFrom:
          	fieldRef:
            	apiVersion: v1
            	fieldPath: status.podIP
      	image: ecr.vip.com/${repo}/clickhouse-server:19.16.14
      	name: clickhouse-server
      	ports:
      	- containerPort: 8123
        	protocol: TCP
      	- containerPort: 9000
        	protocol: TCP
      	- containerPort: 9009
        	protocol: TCP
      	readinessProbe:
        	failureThreshold: 3
        	httpGet:
          	path: /ping
          	port: 8123
          	scheme: HTTP
        	initialDelaySeconds: 5
        	periodSeconds: 10
        	successThreshold: 1
        	timeoutSeconds: 1
      	resources:
        	limits:
          	cpu: "24"
        	  memory: 100Gi
        	requests:
          	cpu: "24"
          	memory: 100Gi
      	volumeMounts:
      	- mountPath: /var/lib/clickhouse
        	name: default-volume-claim
     	serviceTemplates:
	- generateName: '{chi}-{cluster}-{shard}-{replica}-{kubeCluster}'
  	name: replica-service-template
  	spec:
    	clusterIP: None
    	ports:
    	- name: http
      	port: 8123
      	targetPort: 0
    	- name: client
      	port: 9000
      	targetPort: 0
    	- name: interserver
      	port: 9009
      	targetPort: 0
    	type: ClusterIP
	volumeClaimTemplates:
	- name: default-volume-claim
  	reclaimPolicy: Retain
  	spec:
    	accessModes:
    	- ReadWriteOnce
    	resources:
      	requests:
        	storage: 800Gi
    	storageClassName: local-dynamic
  kubeClusters:
  - "38"
  - "45"
FCHC is used to create the ClickHouse cluster on individual Kubernetes clusters in different regions using the open-source operator. The specifications on FCHC has information on cluster dependent Zookeeper nodes and a side-car that exposes ClickHouse metrics in Prometheus format. The custom annotation on our deployment — io.sherlock.metrics — allows us to write back exposed Prometheus metrics back into our metrics platform.
As part of shard creation, the ClickHouse operator annotates pods, which can be used to create a cluster topology. We listen to kube events and get notified on any changes on pod objects.
The ingestion (ingress) and query module (egress), that were built on top of ClickHouse, use a lightweight, custom Kubernetes-based discovery module to use this cluster view. Both the ingestion and query modules are also built and managed on Kubernetes.
We also manage exclusive query clusters – these nodes do not take any write traffic. All distributed table definitions are created on the query cluster.
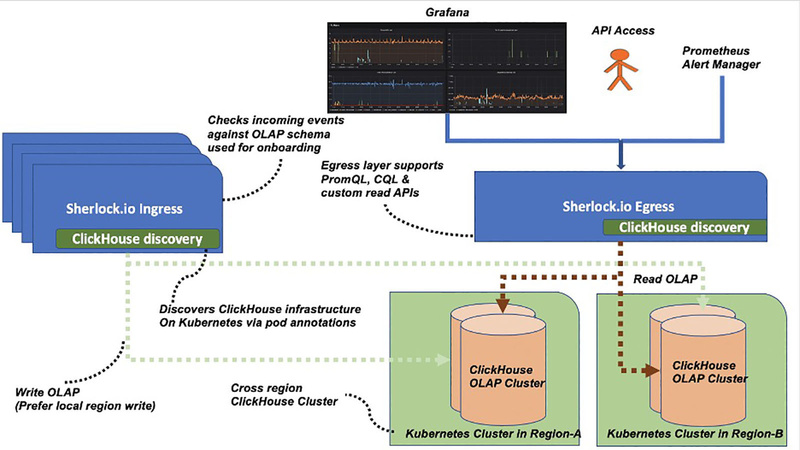
Deployment Overview

Our ingestion layer (ingress) is schema-aware, ensuring every incoming signal adheres to predefined OLAP schema. The ingestion layer uses a discovery module that watches for all Kubernetes events for ClickHouse infrastructure, hosted on our internally managed Kubernetes platform. On the read path (egress), we provide three modes to consume OLAP events data via ClickHouse query language (CQL) and EventQL, our own custom egress APIs. Alerting is enabled by Prometheus alert manager and our support of promQL via remote read APIs allows this integration.
Customers can create alerts via a service layer built on top of the Prometheus alert manager. Our ClickHouse clusters are deployed across different regions or data centers. Our ingestion and egress layers always prefer to write or read into the nearest ClickHouse replica for a shard. Users can visualize the data via Grafana panel or use the ClickHouse Grafana data source plug-in to point to our egress layer directly.
OLAP Schema
We use 14 fields for OLAP data representation, which include details like source application, regions, error, type of event and more. On the ClickHouse backend, this schema translates into multiple tables. Our ingestion layer always writes to the local, concrete table appevent. There are additional buffer tables and a distributed table created on top of this concrete table. Our concrete table definition for OLAP data looks like the following:

Some attributes are defined as LowCardinality on which we expect lower unique values. ClickHouse applies dictionary coding to LowCardinality-columns, and this increases performance of SELECT queries. All of our read queries must have a pool attribute,which indicates application name, and we took advantage of this pattern to create sorting order first on pool and then on source timestamp. Timestamp precision is always in seconds and other labels are also used in sorting order based on query patterns. We have used ClickHouse default value for index_granularity setting.
On top of the raw concrete table, we created materialized views (MV) at intervals of one minute, 15 minutes, one hour and one day for an MV-defined table. Our 15-minute MV table representation is as follows:

Each roll-up table has a different time-based partition key. Higher roll-ups occupy less storage on the disk and have different retention policies configured. Real-time data is always served from the appevent raw concrete table, while other MV tables are used based on the time range mentioned in the read query. For example, if we are querying for the last 12 hours data, we used a one-hour, materialized view table and so on. One-day, MV data is maintained for a period of one year and raw concrete table data is maintained for a period of two days.
Conclusion
With our new, cross-region aware OLAP pipeline, we reduced our overall infrastructure footprint by over 90 percent. Auto-remediation and configuration management provided by eBay’s custom Kubernetes operators have greatly reduced DevOps activity. Our model of using real-time Kubernetes events for ClickHouse infrastructure discovery on our ingestion and query layer has helped to quickly detect changes in infrastructure and handle failures.