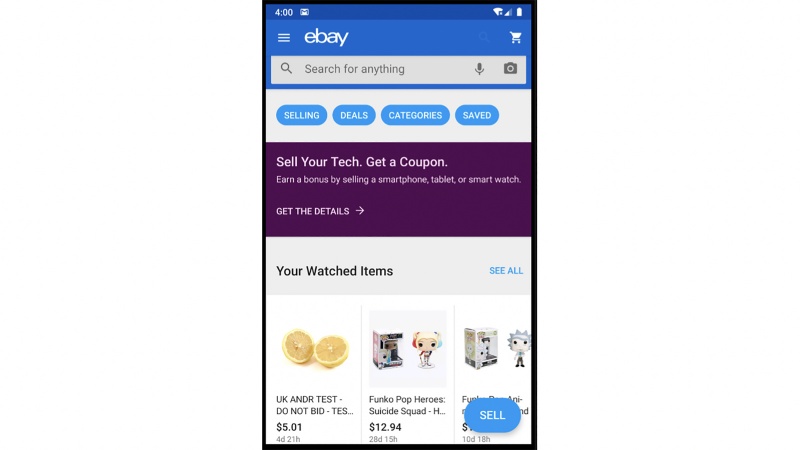
Speed means better customer experience and engagement. There is tremendous value in identifying application speed issues early in the development lifecycle. At eBay, we have a company-wide speed initiative on most visited pages like the Homepage, Listing page and Search pages. With the introduction of speed budgets at eBay, we were tasked with a mission of ensuring that the homepage load times were consistent with every global Android release.
Below are the steps we took to achieve the speed goal.
Measure Application Speed
The eBay Android app uses a backend service to measure the real-world speed metrics. The native app makes calls to this service to drop a speed beacon at critical points in the flow and uses this data to compute a metric called Virtual Visual Complete (vVC). This speed beacon contains timestamps when key transitions occur in the Android lifecycle.
For example:
- lifecycle_create - beginning of the Android Activity onCreate lifecycle method
- lifecycle_start - beginning of the Android Activity onStart lifecycle method
- activity_first_render - completion of Activity onCreate
 These metrics are used to derive the time it takes the page to render ready and can respond to user interactions. Simply, vVc is computed as ‘end time’ minus ‘start time’. Based on the sample data above, it is computed as (activity_atf_render - lifecycle_create. We measure vVC for various sites and app versions. This type of historical data is used to compute the speed budget that the eBay Android home page must adhere to and optimize for future releases.
eBay’s homepage is unique - while we load the homepage, we are also accountable for the app initialization that happens during first launch. To make that possible, we look at both cold boot and warm boot times on Android. To better understand how we can improve our load times, we decided to profile our app initialization logic. The aim of application initialization is to do the minimum amount of work required to show the homepage, so that the user can start interaction with the app right away.
For this, we used the profiler that comes with Android Studio (more details here).
Below are a few tips that worked well within our application. Of note, the best results were with Sampled Java and an API 26 or newer.
● Launch the application using the profile run configuration.
● Stop profiling once the homepage load completes and wait for the call charts to populate.
● Look through the call stacks for Async Tasks, onCreate() of various activities.
● Look at onCreate() as a starting point for profiling for the two activities that are required to launch the homepage.
Success Stories
Parallel vs. Sequential
The homepage response is cached on the app for a few minutes in order to avoid too many disrupting home page refreshes. After the homepage backend call succeeds, we write to the cache, which can take time because this is an I/O operation. To circumvent the slow speed, we parallelize the work needed to write to disk for caching, populating and creating the user interface.
Concentrate on Populating Above the Fold Modules First
One of the “below the fold” homepage modules is populated through a call to a third-party API. In this case, the homepage backend sends a placeholder to where the content would go. The native app makes the third-party API call to populate the content. To decrease the load times, we decided to delay third-party API calls until they were required. Since this module is meant to be below-the-fold, we decoupled the homepage load and below-the-fold content.
Content Comprise for First Launches
When we profiled the application, we noticed that the first call to fetch the Google device identifier was much slower than the subsequent calls. This identifier was needed for a homepage module. This meant that first launch was getting bogged down until the device identifier was fetched. We made a compromise that we will not show this module on first launch, but we will make the call to fetch the device identifier and not wait for the result.
Result
The updates were available on app versions eBay Core v5.28.x+. We were able to achieve ~350-400ms (28%) improvement in our overall load times.
Future
This activity has provided encouraging feedback. To further our success, we use continuous integration tests to monitor app speed daily and during app releases. We also have nightly runs in QA on the native branches where we are constantly measuring speed. These synthetic tests run a few scenarios to replicate real world traffic and provide indications about any site speed degradations. The goal is to identify and fix speed degradations early in the development life cycle.
This blog summarizes our experiences trying to improve application speed - a complex problem with no simple solution. It’s important to note that this article strictly covers the client side optimization efforts. As we iterate over more releases, we may find additional ways to achieve speed optimization.


