In a natural evolution from a services architecture, we at eBay have adopted microservices to help us drive faster and more productive development cycles. eBay’s sophisticated application log infrastructure helped us for the most part, but with the use of microservices, we need to build the next-level infrastructure to visualize and debug microservices and to achieve these goals:
- Make debugging more efficient by reducing time to troubleshoot and debug an API without understanding its upstreams and downstreams.
- Provide clarity and transparency for API developers to understand the caller and callee.
- Treat instrumentation as a primary data point. Logs are great, but technically, instrumentation is a special kind of log.
- Last but not least, the ability to query and visualize the service chain in near real time.
To help achieve these goals, we built Dissect. Dissect is an eBay distributed tracing solution, based on Google’s Dapper, that helps engineers visualize and debug distributed Java and Node.js applications. It identifies how to instrument services and which services to instrument.
How Dissect Works

Benefits
Dissect provides the following benefits:
- Bottleneck Detection. Dissect helps us understand the depth of calls. On most occasions, one single microservice does not cause a bottleneck, and multiple issues can be either up in the chain or downstream calls.
- Developer Productivity. Dissect helps API developers produce a complete call graph and increases the room for optimization of the API.
- Highly Scaleable. Dissect supports eBay’s large volumes of transactions and scales up to billions of requests for eBay’s use cases.
- Polyglot. Dissect includes SDKs for Java and Node.js libraries.
Concepts & Terminologies
The root of the transaction generates CorrelationId and every request generates RequestId.
This figure illustrates the sample Request Flow of a distributed service chaining based on the user’s activity with eBay.
-
CorrelationId– A unique 64-bit identifier that identifies the transaction and propagates across the whole service life chain -
RequestId– A unique 64-bit identifier generated and propagated for everyRequestpart. -
Response– Standard HTTP Response withStatus, Duration.
Terminologies
Dissect borrows the ideas and inspiration from OpenTracing and follows the terminologies:
- A trace is a unit of work performed in a server-bound transaction. An HTTP Request is a trace.
- A span is a unit of work performed in the context of a Trace. Executing an HTTP Client Call is a span. Another example is an outbound HTTP client request in the context of a trace.
Data Construct
Trace and span are defined by this data construct:
| Name | Type | Description |
|---|---|---|
| Name | String | Name of the Trace transaction. (Example: Http Request Path) |
| ID | UUID | Unique ID created or generated. (Example: 64bit UUID) |
| TraceId | UUID | CorrelationId ID propagates across the call chain. Originated when the transaction started. (Example: 64bit UUID) |
| ParentId | UUID | ID of the Transaction |
| Kind | String | Server (or) Client. |
| Status | String | Status of the Trace. (Example: 200 Ok) |
| StartTime | Number | Starting time of the Trace. (Example: Start Time in milli-seconds.) |
| Duration | Number | Time taken to complete the Span transaction. |
| edgeAttribute | Object | |
| edgeAttribute.Method | String | Type of the Transaction. (Example: HTTP Request Method.) |
| edgeAttribute.Caller | String | Caller (or) Callee originated the Transaction. (Example: HTTP Request Connection Address) |
| edgeAttribute.Attributes | Map<String, String> | Custom Key, Value Map of string values. (Example: POOL, Unique LOG ID that served the request.) |
Example Dataset
The following example demonstrates how the TraceId, ParentId, and Id are propagated across different systems.
| id | traceId | PARENTID | Kind |
|---|---|---|---|
| 1 | 1 | server | Server |
| 2 | 1 | 1 | Client |
| 2 | 1 | 1 | Server |
| 3 | 1 | 2 | Client |
| 4 | 1 | 2 | Client |
| 3 | 1 | 2 | Server |
| 4 | 1 | 2 | Server |
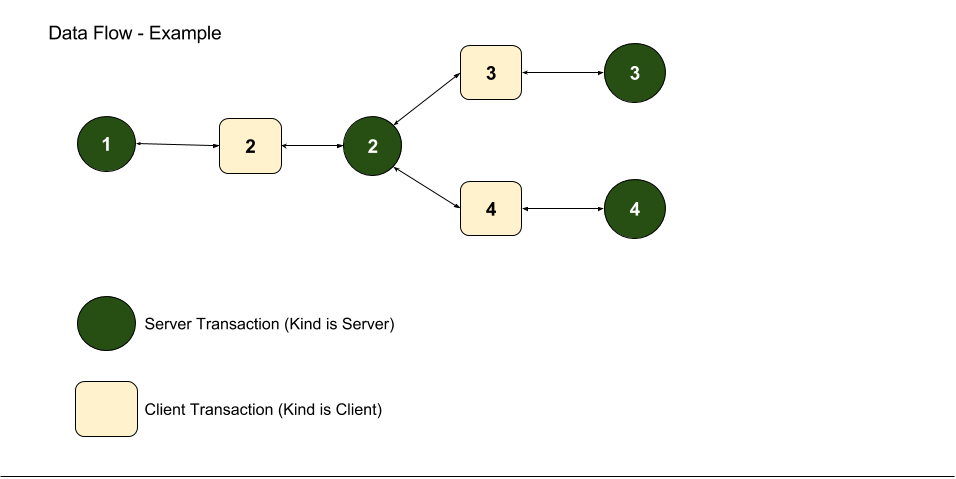
The following figure illustrates the Dissect path. The figure identifies various distributed Service Nodes. Circle nodes are Server Nodes, square nodes are identified as Clients.
Custom Data Attributes
Along with the standard values described above, Dissect captures custom attributes for quicker debuggability. These custom attributes provide enough information to quickly identify the source of the transaction. The following table lists the custom key information captured.
| Name | Description |
|---|---|
| POOL | eBay cloud deployment follows the concept of Pool and Instances. A pool is a cluster of instances serving an application across different regions. |
| Unique LOG ID | Log ID represents the single unit of work. This Log ID is the primary index to identify a request. |
Even though these examples are tailored for HTTP protocols, the implementation is generic enough to adapt to RPCs. After all it is a simple Java and Node.js API.
Sampling
Dissect, by default, allows several modes of sampling strategies:
- Sampling is implemented to collect Sampled Traces across the applications. Also down-stream applications can set up higher sampling rates to collect Traces based on conditions like Failures, Status Codes, and Latency in ms.
- Dissect also allows a sliding window to dissect the requests for every X minutes in X hours. This allows applications to automatically dissect the requests. This approach helps in getting a good sampling rather than a % of sampling.
- Finally, you can use a custom sampling strategy. At eBay we have developed extensible A/B strategies. Applications using an A/B strategy can leverage the same as a sampling strategy for Dissect, also.
Note: The sampling and experimentation platforms have been a part of the eBay platform for some years, and applications can sample based on any of the above strategies and use Dissect to trace the requests.
SDKs
Dissect provides default set of SDKs for developers to quickly boot-strap integration with the Request Stack Trace.
Instrumentation SDKs
Framework Supported Model
The following SDKs support instrumenting your code with Trace. All the SDKs listed below support Java and Node.js implementations.
- Interceptors/Filters
- HTTP request Interceptors (or) filter to intercept all the incomming HTTP request and create a Trace.
- Client Handler
- Client Handler wraps the outbound HTTP client calls and creates a Span transaction for the Trace context.
- Client Handler also maintains lifecycle of the Span.
- JMX Interfaces
- Request Stack Trace provides support for on-demand sampling using JMX interfaces.
- Provides configurations to setup or update Reporters.
Collector aka Reporter SDKs
The collector, aka the Reporter SDK, is responsible for transporting the Dissected requests and reporting to the back-end infrastructure.
- Dissect Reporters
- Reporter is an interface that helps to ship the collected Traces out of the system to a central storage. The default reporter is a simple log line reporter.
- Dissect out of the box supports Kafka Messaging as default reporter.
- Dissect uses the Avro entity as the data format to transport data.
- ElasticSearch is used as the warm datastore to ingest warm data consumed from Kafka streams.
The implementation at Ebay uses Rheos as the datastore and Pronto scaleable ES as the warm storage to query and aggregate results.
Visualizing Traces
We use Kibana dashboards to surface all the collected traces, and a simple waterfall view to visualize a selected Trace.
Aggregation Traces
Visualizing every single Trace is important, but it is not practical to drill through every single Trace. We are evaluating Druid to provide richer and faster aggregation across the collected Traces.
OpenSource Alternatives
When we evaluated the Open Source alternatives to instrument the libraries, we found it compelling to use the Open Source libraries and the polyglot support they offer:
| Alternative | Polyglot Support | Comments |
|---|---|---|
| Apache HTrace | No | Incubator status, and supports only JVM |
| OpenTracing | Yes | Too new at the time I started this effort. We are evaluating OpenTracing for the next iteration. |
| Spring Sleuth | No | Too tightly ingrained towards the Spring eco-system. Obviously Spring alone. |
| Wingtips | No | Too new, and only tailored HTTP Request Filters. |
| Zipkin | Yes | Promising, but most of the constructs are RPC driven. Zipkin Brave was good, but we would have had to do lots of refactoring to adapt it to the existing Spec. |
After evaluating the Open Source alternatives, we decided to go with a standard implementation that suits the standard spec that is already defined and flowing all the sub-systems. A few reasons we made the instrumentation libraries separate implementations include:
- Instrumentation needed to confirm to [wwww.ebay.com][eBay] instrumentation spec:
- Didn’t want to adapt a library and try to retrofit to the standard. Rather, we will come up with a standard instrumentation library that adapts to the existing spec and the data flow.
- Ability for the instrumentation modules to have eBay internal monitoring and operatibility built in. These are plugins that can be injected and operationalized to the eBay infrastructure.
- The ability to instrument based on a custom sampling strategy
- eBay uses sophisticated and robust A/B sampling strategies, and we wanted to leverage this strategy and provide the ability to supply it as a custom sampling strategy.
- Reporters
- Reporters need to emit enough information about monitoring and operatibility in the eBay infrastructure. Dissect internal reporters are built with possible hooks and are integrated with the eBay infrastructure.
- We wanted to take ideas from OpenTracing on semantics and other conventions. OpenTracing was too new for us to pilot a few production-level applications, and we didn’t want external dependencies to derail our timelines.
- Lastly, building a Instrumentation library is easy and quick as long as the standards are defined clearly.
Our goal for designing Dissect is to fill the a Service Tracing need. eBay has sophisticated log, monitoring, and event systems. Dissect complements the missing piece in the puzzle, Service Tracing.
Status of Dissect
Dissect has been widely accepted as a need of the hour inside eBay. Currently, checkout microservices have onboarded with Dissect, and they are extremely happy to see the results. Checkout is a super critical flow for eBay, which explains how important the product is.
Acknowledgements
Large projects and initiatives aren’t successful without the help of many people. Thanks to:
- Sanjeev Kataria
- Gail Frederick
- Venkatesh Ramaswamy
- Mahesh Somani
- Abhishek Pandey
- Venkatesh Palani
- Jancy Vincent